PEB Parsing & API Hashing
Introduction
In this article, we will explore how API hashing and PEB parsing techniques and how to bypass them. This pair of techniques is used to dynamically resolve the address of a function. It is commonly employed in malicious programs with the aim of evading antivirus program analysis and slowing down malicious code analysts. These techniques make the code significantly more challenging to reverse engineer.
From a static analysis perspective, by observing the loaded libraries during execution, we can identify the functions used by the program. In the screenshot below, we are dealing with a program that does not employ the PEB parsing technique:
Now, we observe the same program with the functions VirtualAlloc, VirtualAllocEx and WriteProcessMemory missing, because the PEB parsing technique is used here:
We will notice a difference in the functions loaded from the Kernel32.dll library. Indeed, the functions VirtualAlloc, VirtualAllocEx and WriteProcessMemory are no longer visible statically. Antivirus programs and analysts pay particular attention to programs of unclear origin for which the sequence of functions enabling in-memory injection is used.
As a reminder, the VirtualAlloc function allocates a memory region of a specific size during its call. In the context of shellcode injection, we will specify the shellcode size as the size of the memory region we want to allocate. The WriteProcessMemory function is responsible for writing the shellcode (stored in a variable) into the memory region previously allocated by VirtualAlloc.
How it works
In order to fully understand PEB parsing, it is important to cover certain concepts such as the TEB/PEB structure definitions and how Windows programs manage their resources.
TEB / PEB Structure
The TEB (Thread Environment Block) and the PEB (Process Environment Block) are data structures related to the Windows operating system. These structures enable the proper operation of a process and a thread, they contain a wealth of information. For example, the PEB contains execution parameters, environment variables, handles, loaded modules, etc. As for the TEB, it contains information related to a specific thread of the running process, such as its state, exception handling information, etc.
The PEB is created when the process starts and is stored in the process memory. The TEB is created for each running thread and is stored in the memory of the process to which the thread belongs.
What interests us here are the modules loaded into memory when a process runs. By default a program will load at least these modules: NTDLL.DLL, KERNEL32.DLL and KERNELBASE.DLL.
Modules loaded in memory
The goal will be to iterate through all the structures that let us retrieve the modules loaded in memory. To do this, we will first need to access the TEB structure, which will give us the PEB address. We will then access the PEB structure to find the address of Ldr, which is a pointer to the _PEB_LDR_DATA structure, in order to access the InInitializationOrderModuleList address. This address points to the _LIST_ENTRY structure, which takes the form of a doubly linked list allowing us to navigate between modules forward or backward. The data retrieved from this structure will be used to display the module's full information through the _LDR_DATA_TABLE_ENTRY structure.
Here is a diagram summarising the path to follow:
 To bring more clarity to the explanation above, we will repeat the steps one by one using notepad.exe as an example. First we will open WinDBG and attach to the notepad.exe process in order to run our first command dt _TEB @$teb, where the variable @$teb contains the TEB address:
 Next we will display the PEB structure by specifying its address (we could have directly used the command dt _PEB @$peb but we will keep this logic to apply it in the code):
 We will then retrieve the _PEB_LDR_DATA structure, which will contain the InInitializationOrderModuleList structure at offset + 0x1c:
 The InInitializationOrderModuleList structure is a doubly linked list that links all modules together. This method of data structuring allows the module loading order to be maintained. Here is what the state of the structure looks like for the first module:
 If we want to know which module is loaded, we simply call the _LDR_DATA_TABLE_ENTRY structure with the correct alignment (to do this we simply need to subtract 0x10):
 If we want to know the second loaded module, we proceed as follows:
 When we want to retrieve the parameter containing the module name, we need to know that when we display the _LDR_DATA_TABLE_ENTRY structure we arrive at the InInitializationOrderModuleList parameter, which is why there is an alignment issue and we need to subtract 0x10 to display the structure with correct data. Here is our position before correcting the alignment:
- The module name contained in the BaseDllName parameter which is at [ADDR + 0x20]
- Its base address contained in DllBase which is at [ADDR + 0x08]
Regarding the BaseDllName parameter, the value we would retrieve corresponds to the one at offset 0x30 of the _LDR_DATA_TABLE_ENTRY structure, which is at _LDR_DATA_TABLE_ENTRY+0x30. In the image above we are misled by the BaseDllName parameter indicating its value at position _LDR_DATA_TABLE_ENTRY+0x2c, but if we look at the structure it points to we will realise we need to add +0x4:
 To verify, here is the value contained at [ADDR + 0x20]:
 We can define the data structuring method as shown in the diagram below:
 After displaying the elements of the _LDR_DATA_TABLE_ENTRY structure, we can retrieve the symbols of a module using DllBase. What we should note is that each element of a module is located at a specific offset relative to it, which we can refer to as a relative virtual address. The data structuring within modules remains consistent for all modules.
The element that distinguishes modules is the value of DllBase. Adding DllBase and the relative virtual address will give the real virtual address of the desired data.
Here is the structure diagram allowing us to identify the symbols loaded in the modules:
 As an example, let us take the KERNEL32.DLL module. We will proceed step by step from WinDBG. Let us start by retrieving the signature at offset 0x3c:
 Next we retrieve the value contained at this address and add it to the DllBase value and an offset of 0x78 to reach the relative virtual address (RVA) pointing to the IMAGE_EXPORT_DIRECTORY structure. To access the structure for the KERNEL32.DLL module we simply add the DllBase value to obtain the true virtual address (VA):
 Now that we have the virtual address of the export table we can retrieve two values:
- The number of symbols
- The pointer to the relative address of the symbol list
WinDBG output:
 To obtain the addresses containing the symbol names we will use the following calculation: [ VA symbol list + nb symbol-i * 4 ] + DllBase:
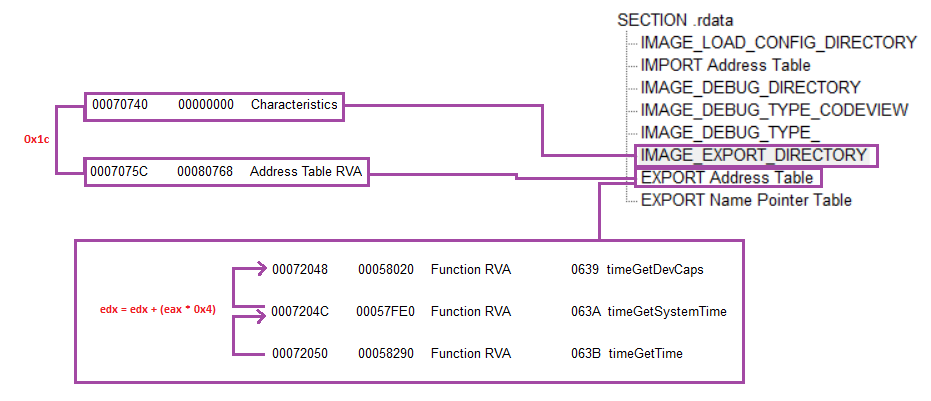
 Finally, obtaining symbol addresses will be done in two steps. First we must go back into the IMAGE_EXPORT_DIRECTORY structure and point to the Ordinal Table RVA parameter, which acts as an index to obtain symbol addresses:
 Still in the IMAGE_EXPORT_DIRECTORY structure, we point to the Address Table RVA parameter which in turn points to the EXPORT Address Table containing the symbol addresses:
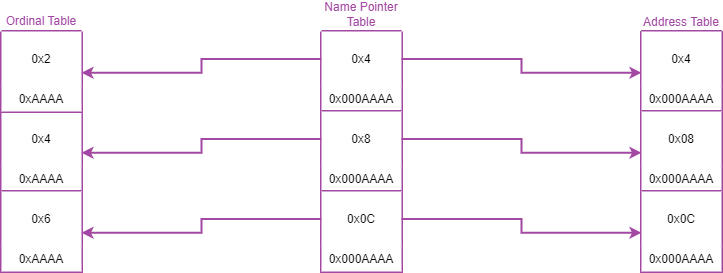
 Here is the relationship between EXPORT Name Pointer Table, EXPORT Ordinal Table and EXPORT Address Table in diagram form:
 Here is the formula adapted to this relationship:
eax = eax + ((ecx - 0x1) * 0x4) // EXPORT Name Pointer Table
eax = eax + ((ecx - 0x1) * 0x2) // EXPORT Ordinal Table
edx = edx + (eax * 0x4)         // EXPORT Address Table
Hash matching
Now, we know how modules are loaded into a process's memory and how to retrieve the addresses of the symbols we are interested in. The goal of the PEB parsing is to dynamically load modules and their symbols stealthily, so it is not desirable to include character strings in our program to test for equality. However, as a first step, we can calculate the hash of a character string, specifically the desired symbol. In a second step, we will calculate the hash of the symbol names that will be enumerated. This is the API Hashing technique.
Here is the function that computes the hash of the current symbol (the esi register contains the name of the symbol being processed, the ebx register contains the DllBase value and the edi register contains the IMAGE_EXPORT_DIRECTORY structure):
hashing:
    lodsb                        ; Load the next byte from esi into al
    test al, al                  ; Check for NULL terminator
    jz compare                   ; Jump into the compare function once the string is read
    ror edx, 0x0d                ; Rotate edx 13 bits to the right
    add edx, eax                 ; Add the new byte into the accumulator
    jmp hashing                  ; Next iteration

compare:
    cmp edx, [esp+0x24]          ; Compare the calculated hash with the hash provided
    jnz enumeration              ; If it doesn't match go back to enumeration function
    mov edx, [edi+0x24]          ; AddressOfNameOrdinals RVA
    add edx, ebx                 ; AddressOfNameOrdinals VMA
    mov cx, [edx+2*ecx]          ; Extrapolate the function's ordinal
    mov edx, [edi+0x1c]          ; AddressOfFunctions RVA
    add edx, ebx                 ; AddressOfFunctions VMA
    mov eax, [edx+4*ecx]         ; Get the function RVA
    add eax, ebx                 ; Get the function VMA
    ret
This approach allows us to reference only the hashes of the functions we want to invoke. Let us take a closer look at a malicious program using this technique.
In its first function, the program will call the sub_4014C0 function twice, passing it the hexadecimal values 0x48317727 and 0x13B56D18 respectively as arguments. We can assume that these hexadecimal values refer to the hashes of the requested functions.
Here is the code of the program's first function:
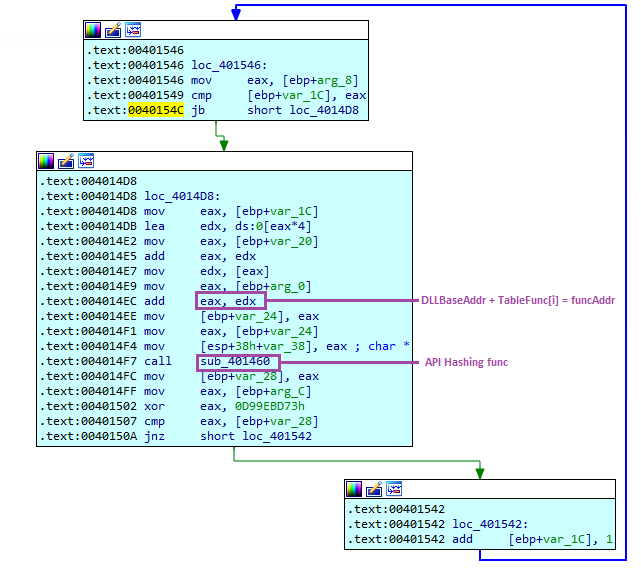
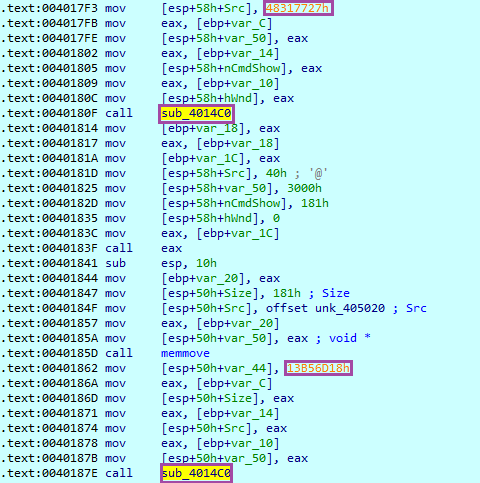 In the sub_4014C0 function we will recognise symbol enumeration and a call to the function sub_401460, which is the function responsible for hashing the string passed as argument:
 At this point, we might naively assume that it is enough to look at the hashing function and retrieve the byte used for the ROR operation. It is noted here that the value 0x0d is used for this operation. However, after modifying our Python hashing program to test all symbols from several modules, we still cannot find the function that is being loaded:
 Back in the previous function we will notice an XOR operation with the hexadecimal value 0xd99ebd73 followed by a conditional jump:
 The XOR operation is performed with the return value of the hashing function, and if the result equals the hexadecimal value sent as argument when calling this function then the program will retrieve the function address. We can define the following pseudocode:
for ( DWORD i = 0; i < (DWORD)NumberOfNames; i++ ) {
    unsigned int hash = apihashing(pFunctionName);
    if ( hash == ( hash ^ 0xd99ebd73 ) ) {
        PEsignature = BaseAddr + 0x3c;

        IMAGE_EXPORT_DIRECTORY_RVA = BaseAddr + PEsignature + 0x78;
        IMAGE_EXPORT_DIRECTORY_VMA = BaseAddr + IMAGE_EXPORT_DIRECTORY_RVA;

        OrdinalTable_RVA = IMAGE_EXPORT_DIRECTORY_VMA + 0x24;
        OrdinalTable_VMA = BaseAddr + OrdinalTable_RVA;

        index = OrdinalTable_VMA + 2 * i;

        FunctionTable_RVA = IMAGE_EXPORT_DIRECTORY_VMA + 0x1c;
        FunctionTable_VMA = BaseAddr + FunctionTable_RVA;

        FunctionAddr_RVA = FunctionTable_VMA + 4 * index;
        FunctionAddr_VMA = BaseAddr + FunctionAddr_RVA;
    }
}
The second hexadecimal value acts as a key. We will notice that this key is hardcoded, which means it is also present in the second call in the malware's first function. We can therefore assume that:
[First hexadecimal value] ^ [hexadecimal key 0xd99ebd73] = real hash.
After verification, we will notice that the first function being called is VirtualAlloc:
 We can verify simply by letting the program run until the next call eax instruction:
 Finally, here is a summary of the steps to follow to defeat this technique:
- Identify the moment when the PEB is retrieved via the fs segment at offset +0x30.
- Identify the moment when the ordinal table offset +0x24 and the address table offset +0x1c are used, since that is the moment when the desired function is found.
- Identify the next call [REGISTER] instruction.
Conclusion
PEB Parsing and API hashing are techniques frequently used by malicious programs, but their implementation is not as straightforward as demonstrated in this article. Moreover, in some programs we may observe the presence of anti-debugging and anti-VM mechanisms associated with these techniques. It is therefore essential to analyse the program step by step in order to understand its logic.